Table of Contents
Tanja Gromadzki (tanja.gromadzki@techdata.com) is Ethics & Compliance Analyst at Tech Data Corp. in Clearwater, Florida, USA.
Measuring various aspects of any compliance program, including program effectiveness, is a constant journey. Increasingly, ethics and compliance departments are leveraging data-driven analysis to gauge how their program is performing. Data visualization is one such tool.
For some, the thought of visualizing data can be daunting and intimidating. But, rest assured, it’s not as scary as you think! The data visualization buzz isn’t just around compliance. Across all industries and functional areas, visualization is becoming more important due to the value and simplicity it can bring to looking at complex problems. Visualizing data helps not only those who are primarily visual learners, but it also helps to better show trends that the compliance program has developed over time as the data and the program grow increasingly more vast and complex.
How does data visualization apply?
In compliance, one area of data collected is in the form of reports received and concerns raised by the colleagues within the business, for example, help line data. This data is often shared with upper-level and executive management in committee meetings, leadership briefings, or regular touchpoints to understand what the general concerns were throughout a specific time frame. It is also leveraged to tell a story: the narrative of what transpired in the compliance program in any given quarter or other determined period of time. Other areas with a wealth of data include training statistics, data on third parties, and even data on communications (e.g., click rates).
Rather than just explaining reporting trends, you can compile data and show those trends in a way that is easy to grasp for management, because they do not necessarily look at compliance data every day. Your audience is much more able to quickly identify spikes or changes in the data and trends over time.
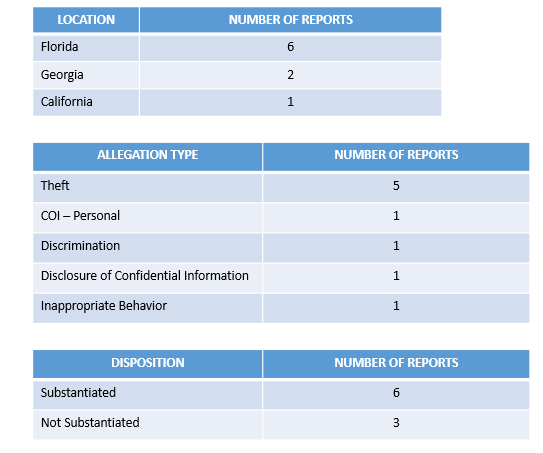
Example 1: Simple analytics in the form of tables easily show where the help line reporting came from, the allegation types for the selected time frame, and the dispositions. These tables are ideal when the data set is not extremely large (see Figure 1).
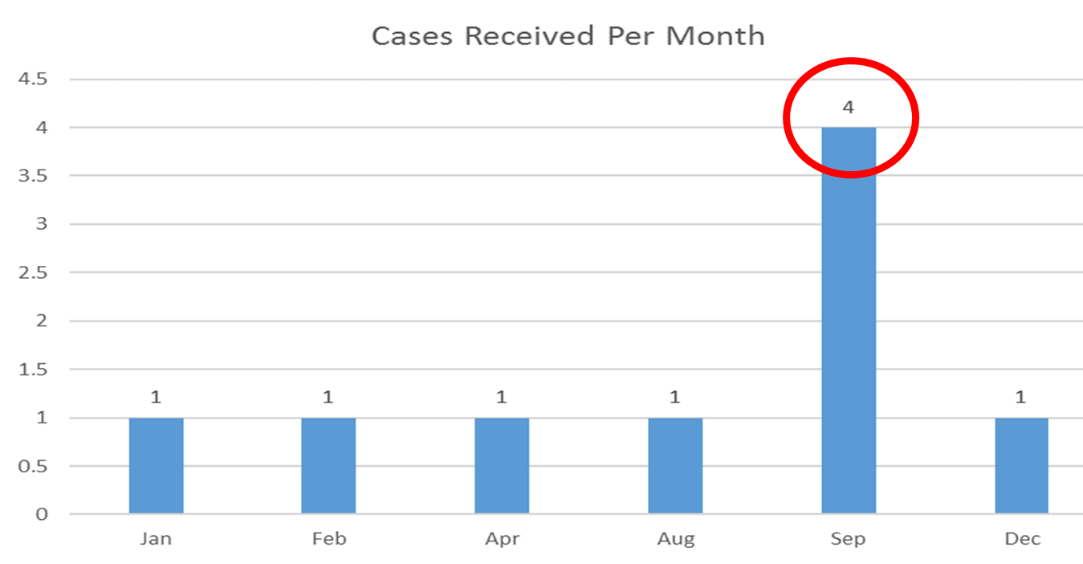
Example 2: Data visualizations are great for helping to identify trends. In the sample bar chart (see Figure 2), it is easy to see that cases were reported consistently throughout the year; however, there was a significant spike in reporting in September. It’s helpful to identify the root cause so readers understand what may have caused the spike in reporting.